Currently browsing author

Martha Stokes CMT

How to Improve Bollinger Bands®

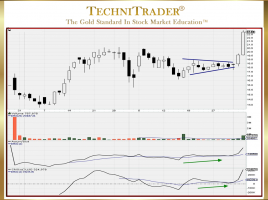
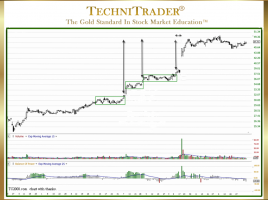
Add Quantity Indicators to Analysis for Stock & Options Trading One of the most exasperating things that happen to Retail Traders and Technical Traders is to find a chart with a perfect setup but the stock has already gapped or ran up with a huge one-day gain, as High Frequency …

Why Use Balance of Power Hybrid Stock Indicator?

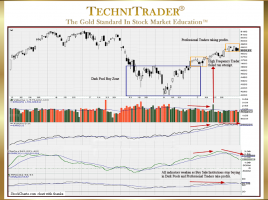
So Powerful It Reveals Dark Pools in the Automated Markets There is one critical factor that separates highly successful traders from those who struggle with mediocre returns. It is the awareness of how new Alternative Trading System (ATS) venues, new order processing, and new algorithms have forever changed how stocks …

Why Is There Clarity Using Bollinger Bandwidth® Indicator?

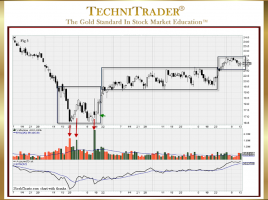
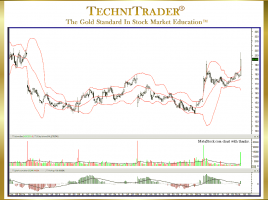
A Technique for Better Bollinger Bands® Analysis Bollinger Bands are by far one of the best indicators for analysis of sideways price action in stocks, finding compression patterns early before High Frequency Trading price surges and providing visual assistance with Spatial Pattern Recognition Skills™ (SPRS) for Beginner Traders. However, using …

How to Identify High Frequency Trader Activity

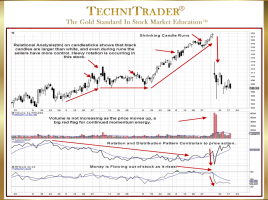
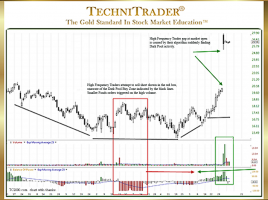
List Provided to Recognize Their Candlestick Patterns High Frequency Trader (HFT) activity occurs often these days, and the HFT candlestick patterns are substantial but unsustainable. Retail Traders who want to learn how to Sell Short during topping markets and downtrends need to be able to identify the “footprints” of the …

How to Identify Selling Short Bounce Areas

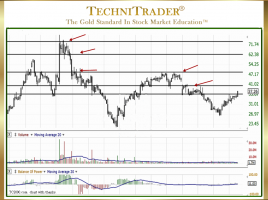
Determine Levels and Strength of Support Topping patterns have undergone dramatic changes in the past decade due to Market Structure changes which have created new types of venues, orders, routing, and Market Participants. Once the new topping formations are identified, the next analysis must be where small and minor non-reversal …

Why Learn Dark Pool Candlestick Patterns?

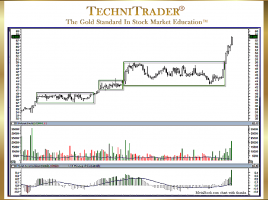
To Enter Stocks Prior to Velocity Runs Dark Pools use precise controlled orders that trigger automatically over extended periods of time. Since the Buy Side Institutions using the Dark Pools are primarily buying for the long term, price can sometimes drop down before moving up. This tendency often leaves Retail …

What Are Spatial Pattern Recognition Skills™?

Reading Stock Charts Like the Professional Traders All Technical Traders need to have very high visual pattern skill development so that they can click through charts quickly and identify patterns that they prefer to trade. Unfortunately for most Retail Traders, this skill is underdeveloped, leaving them to rely too much …

19 pages