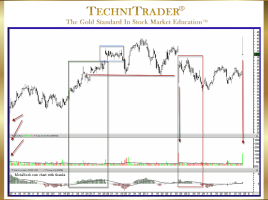
Currently browsing tag

Dark Pools

How to Identify High Frequency Trader Activity

List Provided to Recognize Their Candlestick Patterns High Frequency Trader (HFT) activity occurs often these days, and the HFT candlestick patterns are substantial but unsustainable. Retail Traders who want to learn how to Sell Short during topping markets and downtrends need to be able to identify the “footprints” of the …

How to Identify Selling Short Bounce Areas

Determine Levels and Strength of Support Topping patterns have undergone dramatic changes in the past decade due to Market Structure changes which have created new types of venues, orders, routing, and Market Participants. Once the new topping formations are identified, the next analysis must be where small and minor non-reversal …

Why Are Platform Candlestick Compressions Ideal Entries?

Stock Is Under Dark Pool Quiet Accumulation Platform Candlestick Compressions ideal entries are best for Swing and Momentum Traders, but identifying these compression patterns early is most important. The chart example below is for studying a Relational Technical Analysis™ pattern. This stock was under Dark Pool Quiet Accumulation, which tends …

tracking_quiet_accumulation

Tracking Institutional Investors

Quiet Accumulation/Distribution Indicators The task of finding a simple reliable method for tracking the quiet accumulation of institutional investors in the stock market was no small feat for me many years ago. Market indicators track mostly indexes, advancing versus declining stocks, breadth, and so on which all basically track price …

Trading Range Compression Patterns

Early Entry with Proper Confirmation Spatial Pattern Recognition Skills™ are a technique and skill that needs to be continually improved as technical traders gain experience, and can read charts to interpret candlesticks and indicators with more sophisticated abilities. SPRS takes time to develop but is essential to a full-time career …

downside_action_automated_market

How to Identify Dark Pool Rotation Patterns

Downside Action in the Automated Stock Market Recently, the news media for the retail side of the market stated that the correction the market was experiencing during that week was caused by “investors reaction to the dollar value rising and the risk of the Feds raising interest rates.” Although this …

Candlestick Charts

Candlestick Charts continue to rise in popularity; however, most traders and investors are unaware of the fact that many of the Japanese candlestick patterns, taught in books and generally around the internet in articles no longer form or are as reliable as they were 20 years ago. What has happened …

4 pages