Currently browsing tag

Swing Trading

Where Is Support and Resistance for Position Trading?

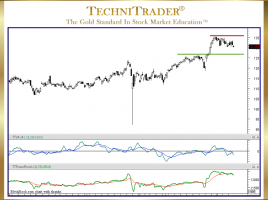
Compression Candlestick Patterns Caused by Technical & Fundamental Traders Position Trading support and resistance are caused by the effect of Technical and Fundamental Traders in the stock. A “compression” pattern is a new candlestick pattern where a group of candlesticks indicate that the stock is poised for a sudden move, …

Why Trade Small Cap Stocks?

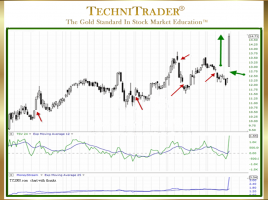
Trade with the Professional Traders for Higher Point Gain Potential Many Retail Technical Traders are still unaware of a gold mine of trading opportunities that can yield higher profits due to wider spreads. The Securities and Exchange Commission (SEC) started a test pilot program for small cap stocks a couple …

Why Use Balance of Power Hybrid Stock Indicator?

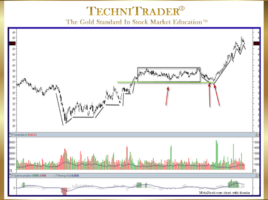
So Powerful It Reveals Dark Pools in the Automated Markets There is one critical factor that separates highly successful traders from those who struggle with mediocre returns. It is the awareness of how new Alternative Trading System (ATS) venues, new order processing, and new algorithms have forever changed how stocks …

Why Is There Clarity Using Bollinger Bandwidth® Indicator?

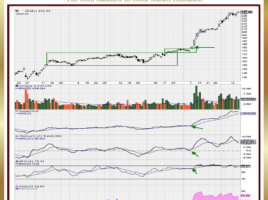
A Technique for Better Bollinger Bands® Analysis Bollinger Bands are by far one of the best indicators for analysis of sideways price action in stocks, finding compression patterns early before High Frequency Trading price surges and providing visual assistance with Spatial Pattern Recognition Skills™ (SPRS) for Beginner Traders. However, using …

Why Are Platform Candlestick Compressions Ideal Entries?

Stock Is Under Dark Pool Quiet Accumulation Platform Candlestick Compressions ideal entries are best for Swing and Momentum Traders, but identifying these compression patterns early is most important. The chart example below is for studying a Relational Technical Analysis™ pattern. This stock was under Dark Pool Quiet Accumulation, which tends …

4 pages