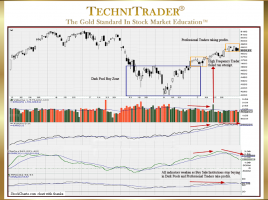
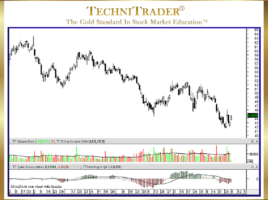
How to Identify Selling Short Bounce Areas

Determine Levels and Strength of Support Topping patterns have undergone dramatic changes in the past decade due to Market Structure changes which have created new types of venues, orders, routing, and Market Participants. Once the new topping formations are identified, the next analysis must be where small and minor non-reversal …

Why Learn Dark Pool Candlestick Patterns?

To Enter Stocks Prior to Velocity Runs Dark Pools use precise controlled orders that trigger automatically over extended periods of time. Since the Buy Side Institutions using the Dark Pools are primarily buying for the long term, price can sometimes drop down before moving up. This tendency often leaves Retail …

What Are Spatial Pattern Recognition Skills™?

Reading Stock Charts Like the Professional Traders All Technical Traders need to have very high visual pattern skill development so that they can click through charts quickly and identify patterns that they prefer to trade. Unfortunately for most Retail Traders, this skill is underdeveloped, leaving them to rely too much …

Why Are Platform Candlestick Compressions Ideal Entries?

Stock Is Under Dark Pool Quiet Accumulation Platform Candlestick Compressions ideal entries are best for Swing and Momentum Traders, but identifying these compression patterns early is most important. The chart example below is for studying a Relational Technical Analysis™ pattern. This stock was under Dark Pool Quiet Accumulation, which tends …

What Are New Bottoming Formations in the Stock Market?

Dark Pool Quiet Accumulation Builds Stock Bottoms During Trading Range Market Conditions when several industries are in their own Bear Market while other industries are continuing a Bull Market, determining when a stock has reached a final low or near the final low is critical for Swing Traders. Typically, they …

Wilder’s Relative Strength Index (RSI) Indicator vs. Stochastic

RSI Indicator Exposes Bottoming Stock Formation Strength Prior to Gaps Wilder’s Relative Strength Index (RSI) has added analysis depth when using the center line oscillation feature. Instead of looking at merely Overbought/Oversold patterns of highs and lows, when Wilder’s Relative Strength Index indicator starts to waver around its center line, …

19 pages