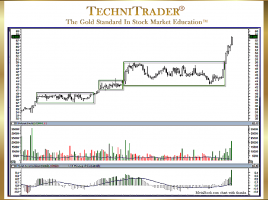
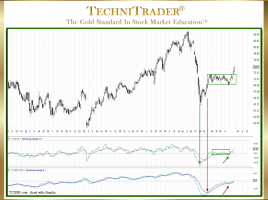
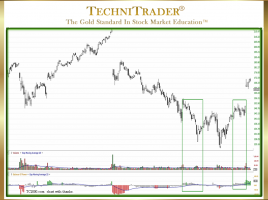
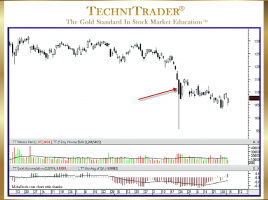
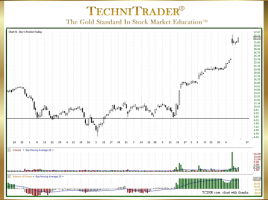
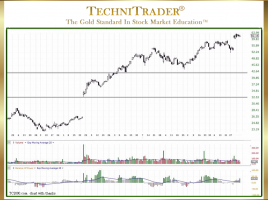
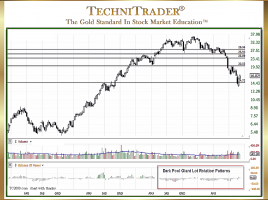
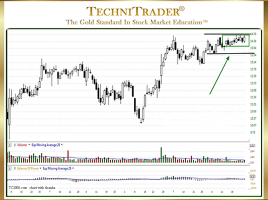
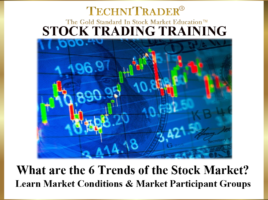
Currently browsing tag

Market Conditions

TechniTrader® Hybrid Indicators for MetaStock Users

About TechniCators™ and Market Conditions for Trading or Investing TechniTrader Stock Market Education groups indicators together based on obtaining a complete and thorough analysis of all the Market Data available. These are typically 5 Hybrid Indicators we created. Each group is called a “TechniCator”, and there are TechniCators for each …

Why Does MACD Give False Signals?

Best & Worst Market Conditions for Using MACD MACD has several key elements that are important to know if you intend to use this indicator as a primary entry signal for Buying Long, Selling Short, or Options Trading. Despite the fact that MACD is extremely popular, empirical evidence shows that …

Why Use Balance of Power Hybrid Stock Indicator?

So Powerful It Reveals Dark Pools in the Automated Markets There is one critical factor that separates highly successful traders from those who struggle with mediocre returns. It is the awareness of how new Alternative Trading System (ATS) venues, new order processing, and new algorithms have forever changed how stocks …

Day Trading vs. Position Trading Stocks Comparison

Differences in Styles, Costs, and Profits Day Trading is the most widely talked about Trading Style for Retail Traders. However, it is the least profitable of all the short-term Trading Styles. This is a little-known fact that no one ever tells Retail Traders when they start to learn to trade …

How to Choose Stock Indicators

7 Tips for Selecting Best Indicators for the Stock Market Today Stock Indicators are one of the most useful tools for Individual Investors and Retail Traders. However, choosing the right indicators for your Trading Style and Strategies can be a daunting task. There are over 250 indicators available in the …

How to Decode a Candlestick Chart with Doji

Use Pure Price as Entry & Exit Signals When Candlestick Charts were first introduced to the western markets, everyone using Stock Charts and Technical Analysis relied on indicators more than Bar Charts, which were the most popular charts back then. Bar Charts are much harder to read, give less visual …

What Are the 5 Key Aspects of Technical Analysis?

Candlestick Patterns Reveal Who, What, Where, When, and Why Technical Analysis is the study and interpretation of price, time, and stock volume for stocks and indexes. Due to the massive changes to the Stock Market Structure since the Banking Debacle and Subprime Mortgage disaster, Technical Analysis has been evolving and …